B Charpiat(1) , V Breant(1) , G Tissier(1) , J M.Sab(1) , P Maire(2) , RW Jelliffe(3)
Croix-Rousse Hospital, Lyon(1)
ADCAPT, Francheville, France(2)
Lab. Applied Pharmacokinetics, USC, Los Angeles, USA(3)
The number of patients (pts) and the number of blood levels (bl) which are appropriate for a pharmacokinetic population analysis is a matter of controversy for which there is no firm answer. We studied this question by performing 203 runs of population analysis with NPEM algorithm, starting with only one pt with one bl, then 2 pts with 1 bl each, until reaching 38 pts with 5 bl each.
Method 42 liver transplant pts treated with cyclosporine (38
with 5 bl, 3 with 4bl, 1 with 1 bl) were studied. For each pt,
one bl was obtained daily (6 am). We used the NPEM algorithm to
estimate the population pharmacokinetic parameters. We studied
the relationship between total apparent volume of distribution
(V) and the clearance (Cl). Ranges of the parameters were 1 to
500 liters for V and 0.5 to 50 liters/hour for Cl. Pt inclusion
in the runs was randomly determined. We first included blood
levels obtained at day 1, then at day 1 and 2, etc...All runs
were set to permit a maximum of 30 iterative NPEM cycles. The
number of NPEM grid points was 20011. The number of intervals
used in calculating the marginal density approximation was 50.
The polynomial equation for the system assay error pattern was SD
( g/ml) = 0.0051+0.011041C +0.033393C2.
Results Figure 1 shows the evolution of the mean value of V as the number of patients and blood levels was systematically increased.
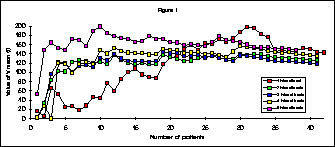
Discussion For 2, 3 or 4 bl the values of mean V become almost equal after about 10 pts. The values then remained stable and the variation was small. With only one bl/pt, the variation was greater. Mean V became similar to those of 2, 3 and 4 groups only after about 35 patients. Similar results were found using median values of V and the mean and median values of Cl, but they converged to a narrower range of values for 2,3,4 and 5 bl. For cyclosporine with a one compartment model, these results show that about 10 to 20 pts (with 2 to 4 bl) appear enough to obtain reliable parameter values in order to perform reasonable adaptive control of the drug dosage regimen.
Conclusion Examination of converging pharmacokinetic parameter values by stepwise increases in the number of patients and blood levels appears to be a pragmatic approach to determine the number of patients and blood levels required for population pharmacokinetic analysis. With 2 to 4 blood levels, the law of large numbers begins to appear after 10 to 20 patients. Such analyses can be performed to check when reasonable parameter values are obtained in population analysis.